Allison Smith
computational biology and climate science

DATA
WATER LEVEL LOGGER DATA
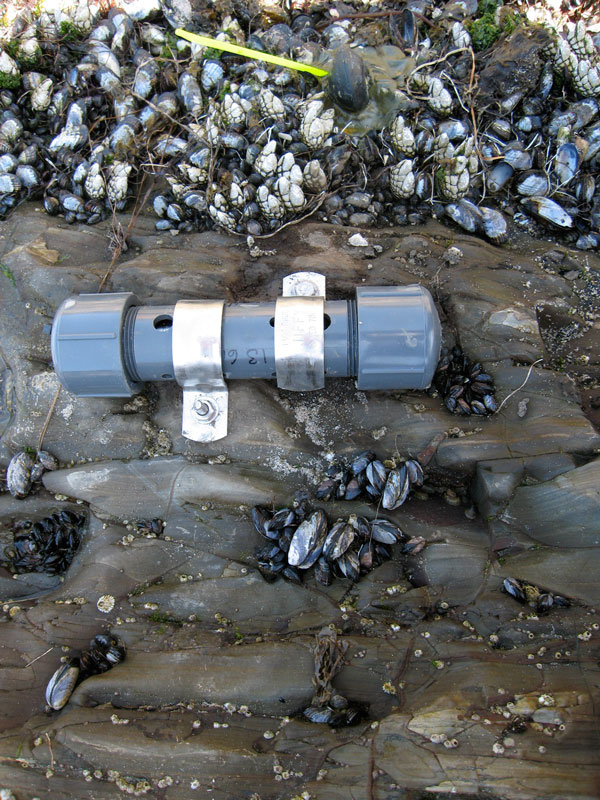
Onset Computer HOBO U20 Titanium Water Level Data Logger's were deployed in wave-exposed rocky intertidal habitats. The loggers were placed in perforated PVC tubing and secured in place in the tubing using cable ties thread through the perforations to protect them from wave action. The tubing was secured to rock substrate using stainless steel straps.
The data in the downloadable files below were minimally processed: The loggers record data in pressure so atmospheric pressure data from a nearby weather station or buoy were subtracted from the original data. Then the data were converted to water level using equation 1 from Mislan et al. (2011). Lastly, drifts in the data due to high temperatures during low tide were removed using equation 2 from Mislan et al. (2011).
Related Publications:
Mislan, K. A. S., Blanchette, C. A., Broitman, B. R., and Washburn, L. (2011). Spatial variability of emergence, splash, surge, and submergence in wave-exposed rocky-shore ecosystems. Limnology and Oceanography, 56(3):857–866
Data Characteristics:
Time Zone is UTC
Time Interval is 2 minutes
File Format for Data: Date (YYYY-MM-DD); Time (HH:MM); Logger Temperature (°C), Water Level (m)
FORCING DATA FOR MODELS OF INTERTIDAL ORGANISM TEMPERATURE
The data products provided below were created from existing sources of data, reanalysis products, and models and processed to create forcing data for biophysical models of intertidal organism body temperature. The data format is based on a forcing file needed for The Community Noah Land-Surface Model (LSM). For our analysis, we modified the Noah LSM to simulate mussel temperatures in intertidal habitats using the method described in Wethey et al. 2011. The columns in the forcing files can be rearranged to meet the forcing file requirements of other biophysical models of intertidal organism temperature.
The tide flag is used to switch the organism temperature to the same temperature as sea water during high tide. Tide flag = 0 is high tide and tide flag = 1 is low tide.
Related Publications:
Mislan, K. A. S. and Wethey, D. S. (2011). Gridded meteorological data as a resource for mechanistic macroecology in coastal environments. Ecological Applications, 21(7):2678–90